Your slow Jira Cloud isn't an infrastructure problem
Jira Cloud runs on Atlassian's infrastructure. That doesn't mean it runs itself.
A pattern I see consistently after migrations: the admin stops thinking about performance the moment the cutover is done. The logic makes sense on the surface — no more servers to patch, no more watching the JVM heap, no more worrying about which app is bleeding memory at 3 AM. Atlassian handles all of that now.
What Atlassian doesn't handle is the shape of your data. And that's where Cloud instances quietly degrade.
What changes — and what doesn't
Moving to Cloud removes a specific category of problems: infrastructure. CPU, memory, garbage collection, disk I/O, database tuning — none of that is your responsibility anymore.
What's still yours is configuration: how many custom fields exist, how they're scoped, how your automations are triggered, how your boards accumulate data over time. These decisions pile up silently. A field created without context today gets indexed against every issue in your instance — even when it's empty, hidden on a screen, and irrelevant to 90% of your projects. An automation rule with a broad trigger is processed on every event that falls within its scope — including the ones the condition discards a moment later. The processing cost is already paid before the discard.
Cloud doesn't make bad configuration cheaper. It makes the consequences invisible for longer.
In the data center, the symptoms were hard to ignore: slow page loads generated support tickets, server metrics pointed to the bottleneck, and the admin had direct access to logs and database queries. On Cloud, you get user complaints with no signal — "Jira feels slow" — and no direct way to confirm what's causing it. By the time the problem is visible to end users, the configuration debt has been building for months.
The most common offenders are few, and they repeat. I'll walk through the five I see most often: four are configuration decisions you own; the last is platform behavior you don't control but need to recognize.
Custom fields without context
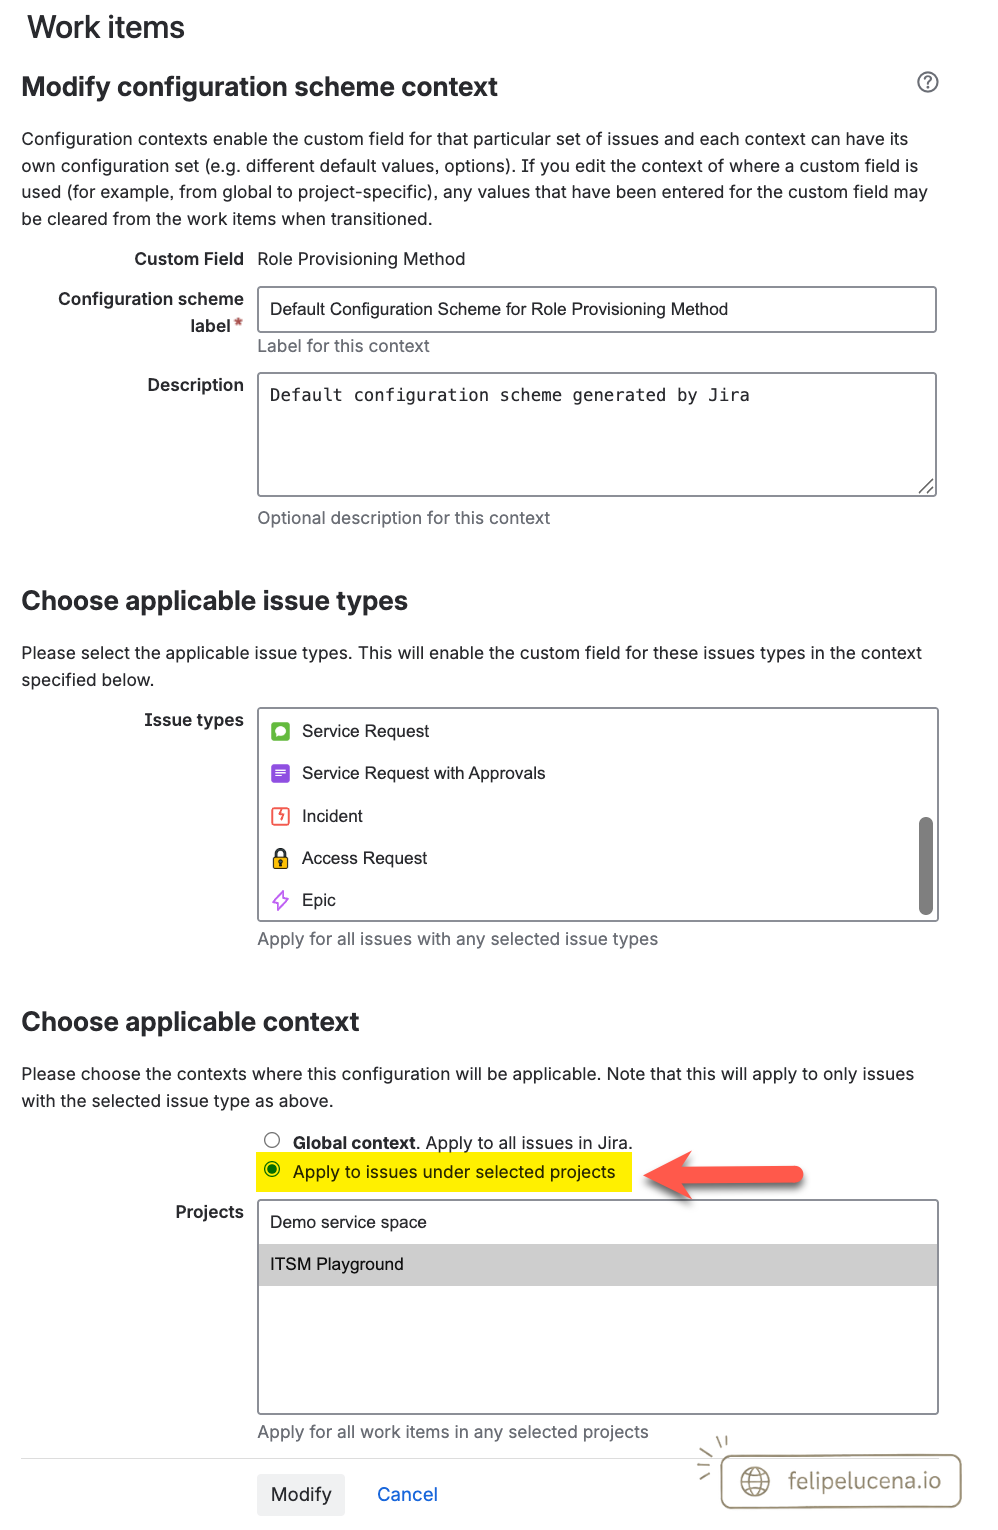
Atlassian documents that a large number of custom fields with global context is the number one cause of performance degradation. Global context means the field is included in the calculations and indexing of every project in the instance — not just where it appears on a screen, but all of them. Atlassian's official Cloud optimization documentation confirms this behavior and explicitly recommends moving fields from global context to project-specific context as a performance action.
It's worth being clear, because the confusion is common: Field Configuration and Context are independent mechanisms. Field Configuration controls rendering behavior — whether the field is required, optional, or hidden on a screen. Context controls existence and scope — which projects and issue types the field exists for in the index. Hiding a field in a Field Configuration does not remove its indexing cost. Only restricting the Context does.
The fix takes one extra step at field creation: scope the context to the projects where the field is actually used. The cost of doing this is trivial — a few extra clicks and two minutes of attention. The cost of skipping it is an index that carries that field on every issue in the instance, indefinitely. It's the difference between a field that indexes 500 issues and one that indexes 500,000.
Automations with broad triggers
At the time of writing, Jira Cloud limits how many automation rules can run at the same time: 10 on Standard, 20 on Premium. When that pool is exhausted, rules queue — and users experience the queue as slowness, with no visibility into why. This concurrency limit is independent of the monthly execution limit; an instance can be far from its monthly cap and still suffer from queuing.
The trigger is usually the problem. "Issue Updated" fires on any change to any field on any issue within the rule's scope. With global scope, every event in the instance passes through the rule — even when the condition discards it immediately.
"Field Value Changed" is the correct trigger for most use cases currently using "Issue Updated." It fires only when a specific field changes. In a high-activity instance, the difference in execution volume is significant.
Boards with an unfiltered Done column
Kanban boards without a date filter on the Done column accumulate issues indefinitely. Atlassian enforces no minimum retention guardrail — "Never" is a valid, permanent option. There's a display cap of 5,000 issues per board, but that doesn't replace governance: a board with 4,000 issues in the Done column is slower than one with 400. Atlassian explicitly recommends using JQL to exclude Done issues from the board filter as a priority performance action.
The most predictable fix is to add a JQL clause to the board filter: AND resolutiondate >= -30d — or whatever retention window fits the team. This limits the Done column to issues resolved in the last 30 days, regardless of later edits. The native interface mechanism uses the updated date, not the resolution date — which means an edited Done issue can resurface on the board. Filtering by resolutiondate in JQL avoids that behavior.
The same logic applies to swimlanes and card colors configured with JQL. Each one re-runs the board's base query with an additional filter. Five swimlanes and five card colors means the board runs its main query eleven times on load. That's not a platform limitation — it's a configuration choice.
Issue links at volume
Every issue link triggers an individual permission check when the issue loads. An issue with 50 links runs 50 permission checks at load time. In instances with complex permission schemes, each check is expensive.
This one scales with use. Teams that rely on Jira for dependency tracking or long-running programs accumulate links naturally. The governance question isn't whether we should use links — it's setting expectations about volume per issue before it becomes a support complaint.
Forge custom fields: a different category
Fields created in Forge behave asynchronously by design — this is documented platform behavior, not a bug. They can take up to 10 seconds to resolve their value after an issue is created. Marketplace apps built on Forge that introduce custom fields bring this behavior into your instance. The delay isn't configurable.
If users are reporting inconsistent field values right after issue creation, this is the likely cause. Unlike the other points on this list, there's no configuration to fix here — only recognizing the behavior and factoring it in when you evaluate the app.
Where to look
There's no single governance panel in Cloud. The tools are fragmented, and each covers part of the work.
Automation Performance Insights is available on every Cloud plan. Inside the Automation module, select … → "View performance insights." It shows execution counts, error rates, and which rules consume the most of your monthly budget. Start here when automation is the suspected cause.
Site Optimizer covers custom fields, work types, and issue volume. It requires Premium or Enterprise. On Standard, field auditing is manual.
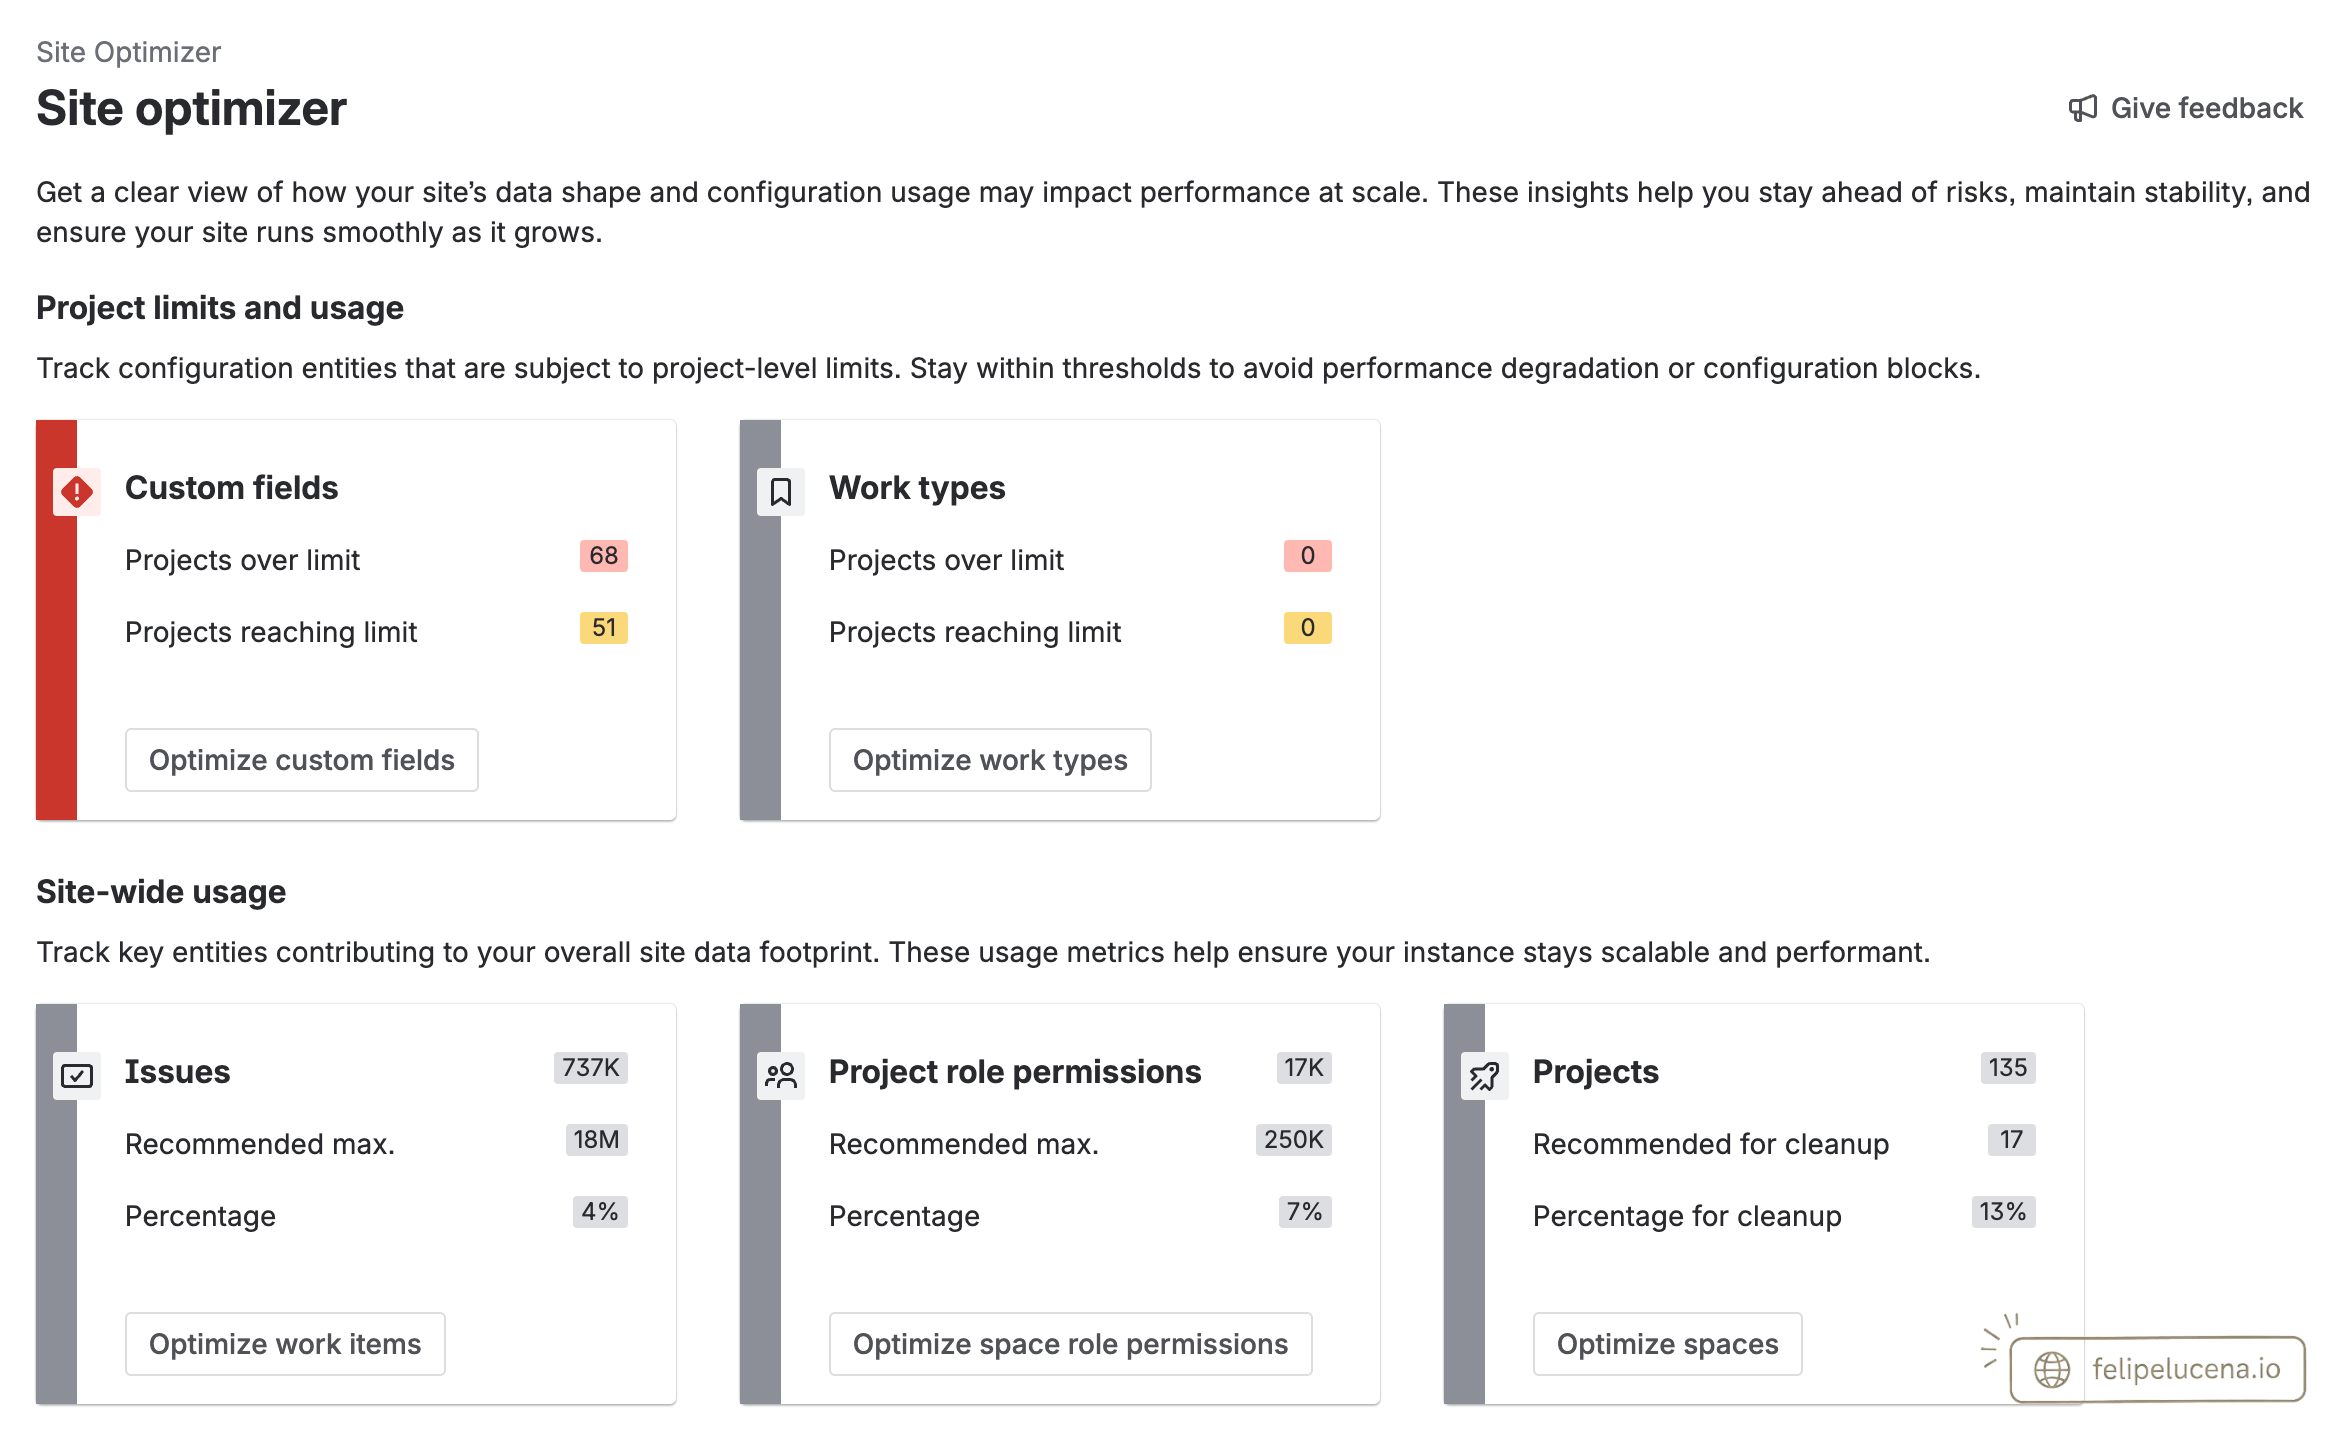
Neither tool covers redundant permission schemes, inactive workflows, or webhook health. These have no native diagnostic tool — they require manual review, and they're part of the governance work that doesn't disappear when you move to Cloud.
None of these offenders is infrastructure. They're all configuration — decisions that pile up silently until they turn into a complaint. Cloud didn't remove the need for governance. It only made the absence of it harder to see.
The infrastructure is Atlassian's problem now. The data inside it is still yours.